Since President Trump’s administration imposed Tariffs on India (post July 2025) my interest in the U.S. economy increased. Heard many podcasts but by education love data so sharing. At the outset say am not an economist. Thanks to Google and guidance from Bureau of Economic Analysis (BEA) got data. Sources given.
Table 1 By GDP which are world’s top Six economies?
|
Country |
In Billion $ 2024 |
In Billion $ 2025 |
|
1. USA |
29,185 |
30,507 |
|
2. China |
18,748 |
19,232 |
|
3. Germany |
4,858 |
4,745 |
|
4. Japan |
4,026 |
4,186 |
|
5. India |
3,909 |
4,187 |
|
6. Russia |
2,161 |
2,076 |
Source Statisca.com and Here
The U.S. constitutes about one-third of global GDP. China has to catch up. India has lots to catch up.
Table 2 What is the growth rate in U.S. GDP over the years?
|
Year |
Rate % |
GDP Trillion $ |
|
2024 |
2.8 |
29.18 |
|
2023 |
2.89 |
27.721 |
|
2022 |
2.51 |
26.007 |
|
2021 |
6.06 |
23.681 |
|
2020 |
2.16 |
21.354 |
|
2019 |
2.57 |
21.540 |
|
2018 |
2.97 |
20.657 |
|
2017 |
2.46 |
19.612 |
|
2005 |
4.08 |
13.039 |
|
2000 |
3.48 |
10.251 |
Source Macrotrends.net and Here “Annual percentage growth rate of GDP at market prices based on constant local currency. Aggregates are based on constant 2010 U.S. dollars.” Column 3 source data Here
GDP growth rates hover around 2.5 to 3% with a high of 6.06% in 2021. Between 2000 and 2024 the size of the economy has trebled.
India has higher growth rates than the U.S. but look at the size of the economy and value add in absolute terms.
3. What are the components of US GDP
Search replied, “The U.S. GDP is primarily comprised of four expenditure components: Personal Consumption (household spending), Gross Private Investment (business spending on capital and inventory), Government Spending (government purchases of goods and services), and Net Exports (exports minus imports). Consumption is the largest component.”
“The largest sector contributing to the U.S. GDP is the service sector, which accounted for 76.4% of the GDP in 2021. Within that, the finance, insurance, real estate, rental, and leasing industry is a major component, representing 21.2% of GDP in 2024. By state, California is the largest contributor to the U.S. GDP, according to 2024 data, with $4.1 trillion.”
Personal Consumption plays a big role in GDP size. Since the U.S. has Net Imports that reduces GDP, correct. The U.S. today is more of a Services economy so exports services much more than merchandise unlike say China.
4. What is the capital expenditure of the U.S. government?
A search revealed that, “The capital expenditure for the U.S. government in 2024 is not explicitly stated as a single figure in the search results, as it is not a standard way to categorize federal spending.” Read about how the U.S. accounts for spending Here (fiscaldata.treasury.gov)
Unlike in India, where capital expenditure today is seen as a prime GDP mover.
5. What is GDP by industry?
Source is Bureau of Economic Analysis-official site of the U.S. government- Here
Table 3 Valued Added by Industry Year 2024
|
As a % of GDP given where > 5% |
Billions of $s |
As a % of GDP |
|
1.Gross Domestic Product |
29185 |
|
|
2. Private |
25891 |
|
|
3. Agriculture, Farming, Forestry & Hunting |
248 |
|
|
4. Mining |
394 |
|
|
5. Utilities |
437 |
|
|
6. Construction |
1312 |
|
|
7. Manufacturing |
2913 |
9.50 |
|
8. Wholesale Trade |
1707 |
|
|
9. Retail Trade |
1841 |
6.01 |
|
10. Transportation & Housing |
969 |
|
|
11. Information |
1569 |
5.12 |
|
12. Finance, Insurance, Real Estate, Rental & Leasing |
6190 |
20.20 |
|
Finance and Insurance 2164 |
||
|
Real estate & Rental Leasing 4026 |
||
|
13. Professional & Bus Services |
3847 |
12.55 |
|
14. Profess, Scientific & Technical Services |
2381 |
|
|
15. Mgmt of Companies & Enterprises |
539 |
|
|
16. Administrative & waste mgmt. services |
927 |
|
|
17. Education, Health care and Social Assistance |
2542 |
8.29 |
|
18. Arts, entertainment, recreation, accommodation, and food services |
1293 |
|
|
19. Other Services except govt |
627 |
|
|
20. Government |
3294 |
10.75 |
|
TOTAL |
30651 |
100 |
Source-U.S. Bureau of Economic Analysis. June 26, 2025
Share of Agriculture in the U.S. economy is .81%. However, if we combine agriculture, food and related industries contribution is app 5-6%.
Table 4 Based on the above table the key sectors contributing to GDP are-
|
Sector |
% of GDP |
|
1. Finance, Insurance, Real Estate, Rental & Leasing |
20.2 |
|
2. Professional and Business Services |
12.6 |
|
3. Education, Health care and Social Assistance |
8.4 |
|
4. Government |
10.8 |
|
5. Wholesale and Retail Trade |
11.6 |
|
6. Manufacturing |
9.5 |
So U.S. has essentially become a services economy i.e. driven by private consumption. A lot of services are consumed by businesses and government too.
6. Which are the 10 Biggest Industries by Revenue in 2025?
According to Ibsworld.com link here the industries are Health & Medical Insurance in the US., Hospitals in the US., Commercial Real Estate in the US., Commercial Banking in the US. Drug, Cosmetic & Toiletry Wholesaling in the US., New Car Dealers in the US., Gasoline & Petroleum Bulk Stations in the US., Public Schools in the US., Property, casualty and Direct Insurance in the U.S., and Life Insurance and Annuities in the U.S.
All are service industries and dependent on consumer spends.
7. What is the share of Manufacturing in the U.S. GDP?
According to www.nist.gov.el and link Here “In 2023, Manufacturing contributed $2.3 trillion to U.S. GDP amounting to 10.2 % of total U.S. GDP, measured in chained 2017 dollars, according to BEA data.”
According to this World Bank Indicator
Table 5 TREND of Manufacturing Value Add in the U.S. as a % of GDP
|
Year |
Percentage |
|
2000 |
15 |
|
2005 |
13 |
|
2010 |
10 |
|
2015 |
11 |
|
2020 |
10 |
|
2024 |
10 |
Manufacturing value add has fallen from 15% in 2000 to 10% in 2024. Scholars may analyse if it is the result of imports from China! Or Has the percentage fallen because U.S. companies in their search for profits outsourced manufacturing to China. Hope India does not repeat the same mistake.
What President Trump is trying to do is to bring up manufacturing to the U.S. and make the 10% move upwards. Not easy and will take time!
According to this PIB Press Release dated 25/3/25 manufacturing contributes 17% to India’s GDP. The goal is to make it 25% by 2047.
According to this World Bank Indicator Manufacturing Value Add in India as a % of GDP was 16% in 2000, 17% in 2010, 15% in 2018 and 13% in 2023.
8. What is the U.S. Debt GDP ratio?
According to Tradingeconomics.com link Here, the numbers are-
Table 6 Gross Federal Debt as a % of GDP
|
Year |
% |
%3 |
|
2017 |
104 |
103 |
|
2018 |
105 |
104 |
|
2019 |
107 |
104 |
|
2020 |
126 |
122 |
|
2021 |
124 |
122 |
|
2022 |
122 |
119 |
|
2023 |
122 |
118 |
|
2024 |
124 |
121 |
3 As per Federal Reserve Bank of St Louis. Total Public Debt as Percent of Gross Domestic Product. To read What is National Debt
The debt to GDP ratio entered the 120 range during the pandemic and has remained there since. According to fiscaldata.treasury.gov, reasons for increase are “Notable recent events triggering large spikes in the debt include the Afghanistan and Iraq Wars, the 2008 Great Recession, and the COVID-19 pandemic. From FY 2019 to FY 2021, spending increased by about 50%, largely due to the COVID-19 pandemic. Tax cuts, stimulus programs, increased government spending, and decreased tax revenue caused by widespread unemployment generally account for sharp rises in the national debt.”
Some of Trump’s moves, like ending Ukraine War and making Europe pay for its security, are aimed at reducing government debt.
8. What is the value of U.S. Arms Exports?
According to www.statisca.com and Here “The statistic shows total U.S. arms exports in the years 2000 to 2024 expressed in TIV. The TIV is based on the known unit production costs of a core set of weapons and is intended to represent the transfer of military resources rather than the financial value of the transfer. The TIV is expressed here in million constant U.S. dollars as of 1990. In 2024, the U.S. arms exports totalled to about 13.5 billion constant (1990) U.S. dollars.”
Table 7 US Arms Exports expressed in TIV Million $
|
Year |
Million $ |
|
2000 |
7662 |
|
2015 |
9868 |
|
2020 |
9532 |
|
2022 |
15592 |
|
2024 |
13512 |
To see chart of year-wise U.S. Arms Exports click Here
9. What are U.S. Arm Exports as a Percentage of GDP?
Table 8 – Arms Exports as a % of GDP
|
Year |
TIV Billion $ |
GDP Trillion |
TIV as a % of GDP |
|
2020 |
9.532 |
27.72 |
.03 |
|
2021 |
11.074 |
26.00 |
.04 |
|
2022 |
15.592 |
23.68 |
.07 |
|
2023 |
11.102 |
21.35 |
.05 |
|
2024 |
13.512 |
29.18 |
.05 |
10. Contribution of U.S. Technology Companies to Global Profit?
According to this article in Mckinsey.com, “Much of this increase ($247 billion) has been driven by the so-called Magnificent Seven companies from the technology sector: Alphabet, Amazon, Apple, Meta Platforms, Microsoft, NVIDIA, and Tesla.
But the relative rebound in global economic profit is not just a technology story; the tale also involves companies in other regions and sectors. For instance, US and Canadian companies outside the technology sector, excluding energy and materials, accounted for $165 billion of the increase. And Mainland Chinese companies, excluding energy and materials, added $67 billion.
The Magnificent Seven collectively realized $247 billion in economic profit between 2020 and 2024—a staggering 840 percent increase over the past 15 years. That $247 billion accounts for almost a quarter of all the economic profit generated globally.”
What percentage of global profit by the Magnificent Seven is contributed by Indian Talent and Outsourced Operations to India is a number worth ascertaining.
This June 2025 Times of India report has some interesting data.
Table 9 Top Employers for STEM-OPT students
|
1.Amazon |
6,679 |
|
2. Google |
1,778 |
|
3. Microsoft |
1,496 |
|
4. META |
1,302 |
|
5. University of California |
1,302 |
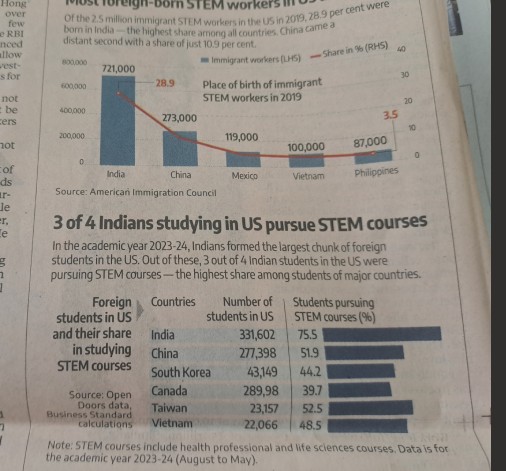
According to a report in the Business Standard dated 27/9/25, “Nearly one-fourth of STEM workers in the U.S. are foreign born. Of the 2.5 million immigrant STEM workers in the U.S. in 2019, 28.9% were born in India- the highest share amongst all countries. China was a distant second. In the academic year 2023-24, Indians formed the largest number of foreign students in the U.S. Out of these, 3 out of 4 were pursuing STEM courses – the highest share amongst students of major countries.” Source American Immigration Council.
11. What are the number of Indian students in the U.S.?
Search - According to the Open Doors Report 2024, there were 331,602 Indian students in the U.S. for the 2023-24 academic year, making India the top country of origin for international students in the U.S.
According to this Times of India report, “Nearly 4.2 lakh Indian students went to the U.S. in 2024.”
Table 10 Number of Foreign Students in USA by country
|
Country |
Number |
|
1.India |
4,22,335 |
|
2. China |
3,29,541 |
|
3. South Korea |
61,277 |
|
4. Canada |
46,536 |
|
5. Brazil |
44,721 |
I am not even trying to ascertain their contribution to the U.S. economy. Their parents pay in U.S. dollars. Such payments not considered part of the trade deficit.
12. What is GDP by State 2024 – Top 10 States?
Data from BEA website and Here . For 2023 numbers click on link.
For table see below. The top states are California, New York, Florida, Illinious and Pensalyvenia.
California leads because of the presence of Big Tech firms. New York leads because it is a global Financial Centre. While there is a strong Indian presence in California it would be interesting to know about Indians in New York State.
The three biggest items of agricultural product exports from the U.S. are corn, soya bean and wheat. Till 2019 the U.S. had an agricultural trade surplus. Read about U.S. Agricultural Trade
Utmost care taken in culling out numbers. Errors if any are inadvertent and without malafide intent.
Also read earlier articles
This is the ninth in a series of articles post Trump Tariffs. One, explained what is trade deficit? Two, looked at both the trade and geo political issues. What does U.S.A. want? What is President’s Trump’s approach and Implications? 15 IDEAS how India can respond. Three, Look at Trade Deficit Numbers after removing APPLE Iphone exports Four, US Needs Indian Pharma products and India needs US market . Five, Cooperate, Compete, Aatmanirbharta should be India’s MANTRAS in this UNCERTAIN world . Six, What India Inc MUST DO to Reduce Imports from China . Seven, 15 Ways India can respond to U.S. Sanctions Eight, Explained Why the U.S. IMPORTS Petroleum Products from India
Table 11 2024 Current Dollar Gross Domestic Product by State Millions of $
|
State |
2024 |
|
1. California |
41,03,124 |
|
2. New York |
22,97,028 |
|
3. Florida |
17,05,565 |
|
4. Illinois |
11,37,244 |
|
5. Penselvania |
10,24,206 |
|
6. Ohio |
9,27,740 |
|
7. Georgia |
8,82,535 |
|
8. Washington |
8,54,683 |
|
9. New Jersey |
8,46,587 |
|
10.North Carolina |
8,39,122 |
|
11. Massachusetts |
7,80,666 |
|
Total |
2,91,89,840 |